
Sharpe Ratio Explained
Understand how the Sharpe Ratio compares investment returns with risk and why higher returns are not always better returns.
What Is the Sharpe Ratio?
The Sharpe Ratio is one of the most widely used measures of risk-adjusted performance in finance. It compares the excess return of an investment with the amount of volatility taken to achieve that return.
The basic idea is straightforward: two portfolios may generate the same return, but one may experience much larger price fluctuations. In that case, the more stable portfolio may have delivered a better return relative to the risk taken.
The Sharpe Ratio asks how much excess return an investment generated for each unit of volatility. It is commonly used to compare portfolios, funds, strategies and asset allocations.
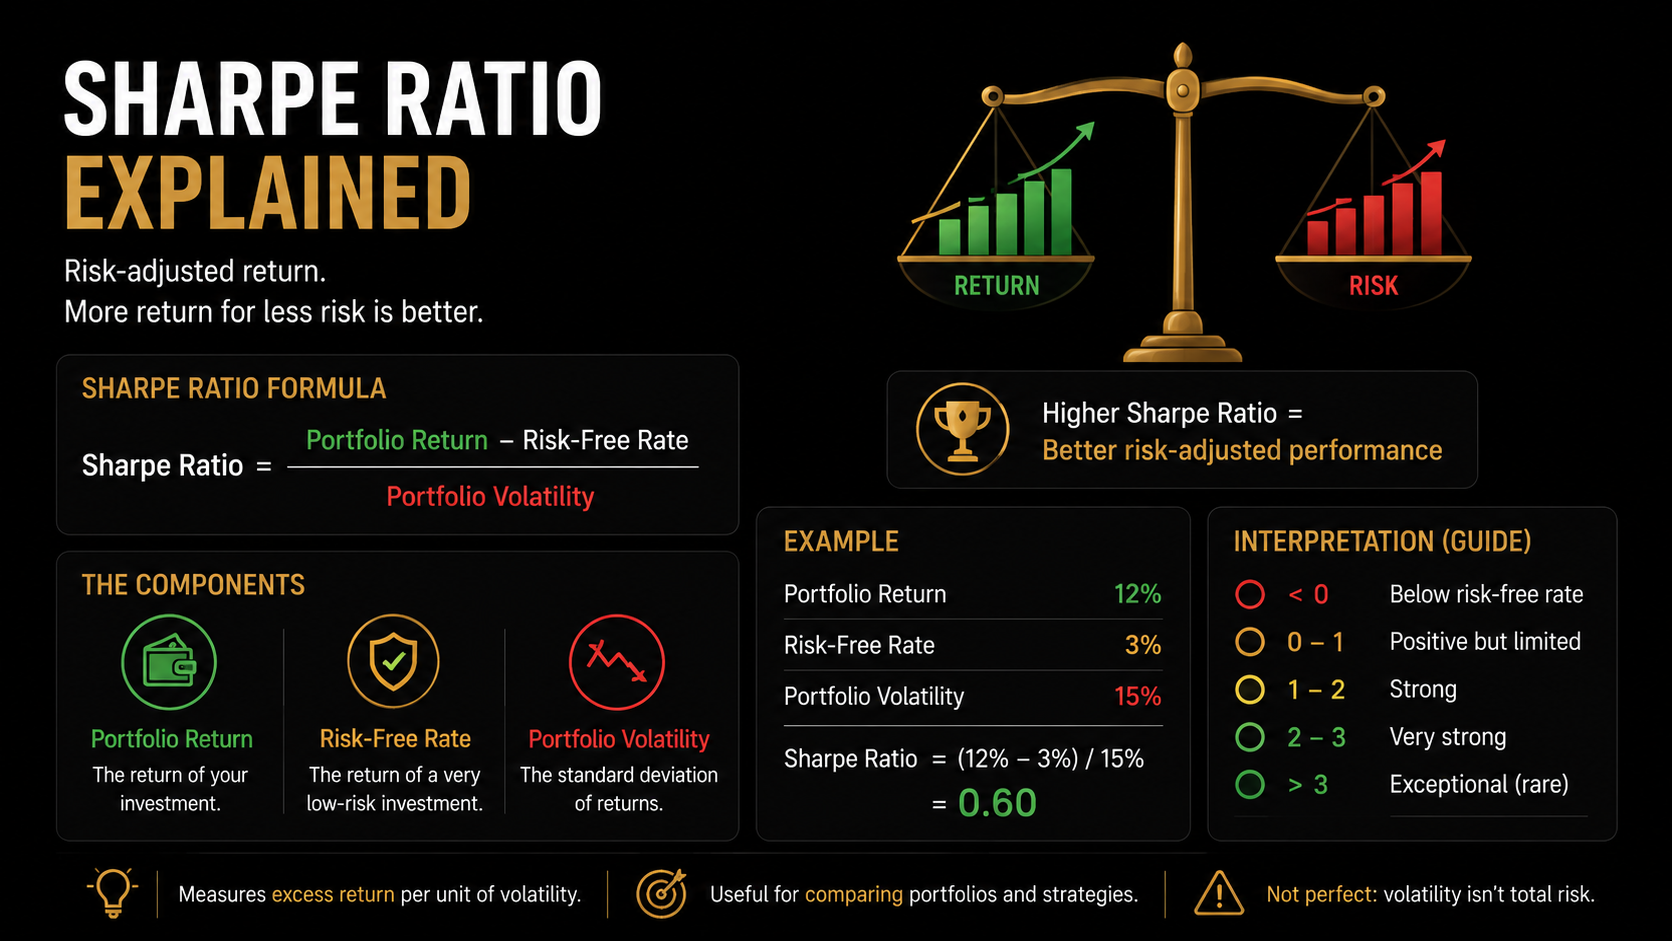
The Sharpe Ratio Formula
Sharpe Ratio = (Portfolio Return − Risk-Free Rate) ÷ Portfolio Volatility
The components are:
Portfolio Return: the return generated by the investment or portfolio.
Risk-Free Rate: a reference return associated with a very low-risk investment over a comparable period.
Portfolio Volatility: usually the standard deviation of portfolio returns.
The subtraction of the risk-free rate matters because the Sharpe Ratio focuses on excess return. It asks whether the investor was compensated for taking additional risk beyond a low-risk alternative.
A Simple Example
Imagine a portfolio with the following characteristics:
Portfolio return: 12%
Risk-free rate: 3%
Portfolio volatility: 15%
First, calculate the excess return:
Excess Return = 12% − 3% = 9%
Then divide the excess return by volatility:
Sharpe Ratio = 9% ÷ 15%
Sharpe Ratio = 0.60
In this simplified example, the portfolio generated 0.60 units of excess return for each unit of measured volatility.
Why Risk-Adjusted Return Matters
Suppose two portfolios both return 10%.
Portfolio A has volatility of 8%, while Portfolio B has volatility of 20%. Looking only at total return would make them appear equally successful, but Portfolio B experienced much greater fluctuations to achieve the same result.
The Sharpe Ratio helps reveal this difference. It does not simply ask how much money was made; it asks how efficiently return was generated relative to measured volatility.
This makes the ratio especially useful when comparing strategies with different risk profiles.
A Comparison Example
Consider two hypothetical portfolios using the same 3% risk-free rate.
Portfolio A
Return: 11%
Volatility: 10%
Sharpe Ratio = (11% − 3%) ÷ 10% = 0.80
Portfolio B
Return: 14%
Volatility: 20%
Sharpe Ratio = (14% − 3%) ÷ 20% = 0.55
Portfolio B generated the higher absolute return, but Portfolio A achieved the higher Sharpe Ratio. Based on this measure, Portfolio A delivered more excess return per unit of volatility.
Higher return does not automatically mean better risk-adjusted performance.
Sharpe Ratio vs Alpha
The Sharpe Ratio and alpha answer different questions.
Alpha attempts to measure performance beyond what would be expected from a portfolio’s market or factor exposure. The Sharpe Ratio compares excess return with total measured volatility.
A strategy can therefore have positive alpha but a relatively weak Sharpe Ratio if its returns are highly unstable. Similarly, a diversified portfolio may have a strong Sharpe Ratio without generating significant alpha.
Both measures provide useful information, but they should not be treated as interchangeable.
The Main Limitation: Volatility Is Not Total Risk
The Sharpe Ratio uses volatility as its primary measure of risk. As discussed in the BondStats lesson on volatility, this creates an important limitation because volatility does not capture every form of financial risk.
A portfolio may have low historical volatility while still containing:
liquidity risk,
credit risk,
leverage,
concentration risk,
tail risk,
hidden exposure to rare events.
The Sharpe Ratio may therefore make some strategies appear safer than they truly are.
Upside Volatility Can Be Penalized
Another limitation is that standard deviation includes both positive and negative fluctuations. A large positive return can increase measured volatility even though investors may not consider strong upside performance undesirable.
This is one reason analysts sometimes use the Sortino Ratio, which focuses more specifically on downside risk rather than total volatility.
Why the Time Period Matters
A Sharpe Ratio calculated during a calm bull market may look very different from one calculated across a recession or financial crisis. Results can also change depending on whether the analysis uses daily, monthly or annual observations.
Short periods can be particularly misleading because a strategy may temporarily appear highly efficient simply because a major adverse event has not yet occurred.
For meaningful comparisons, investments should generally be evaluated using consistent assumptions and comparable time periods.
When the Sharpe Ratio Can Mislead
The Sharpe Ratio may provide an incomplete picture when returns are highly asymmetric, extreme losses occur more often than expected, assets are illiquid or leverage creates hidden vulnerabilities. Strategies with many small gains and occasional severe losses can sometimes show attractive historical Sharpe Ratios before a major negative event occurs.
This does not make the ratio useless. It means the result should be combined with other measures such as maximum drawdown, Expected Shortfall, stress testing and liquidity analysis.
Key Takeaways
The Sharpe Ratio measures excess return relative to volatility and is one of the most common tools for evaluating risk-adjusted performance. A higher ratio generally suggests that an investment generated more excess return for each unit of measured volatility.
However, the Sharpe Ratio is not a complete measure of risk. It depends on historical data, treats upside and downside volatility similarly and may fail to capture liquidity problems, leverage or extreme tail events. For this reason, it is most useful as part of a broader risk-management framework rather than as a standalone score.