
Volatility and Risk
Understand how price fluctuations are measured, why volatility matters, and why true financial risk extends far beyond market movements.
Volatility and Risk
Volatility is one of the most widely used concepts in finance.
It appears in:
portfolio analysis,
risk models,
options pricing,
asset allocation,
performance evaluation,
stress testing,
market commentary.
When markets move sharply, volatility often becomes the dominant topic but volatility is frequently misunderstood.
A volatile investment is not automatically a bad investment, a stable investment is not automatically a safe investment and low volatility does not guarantee low risk.
Volatility measures how much returns fluctuate. Risk describes the broader possibility of an adverse outcome. Understanding this distinction is fundamental to modern risk management.
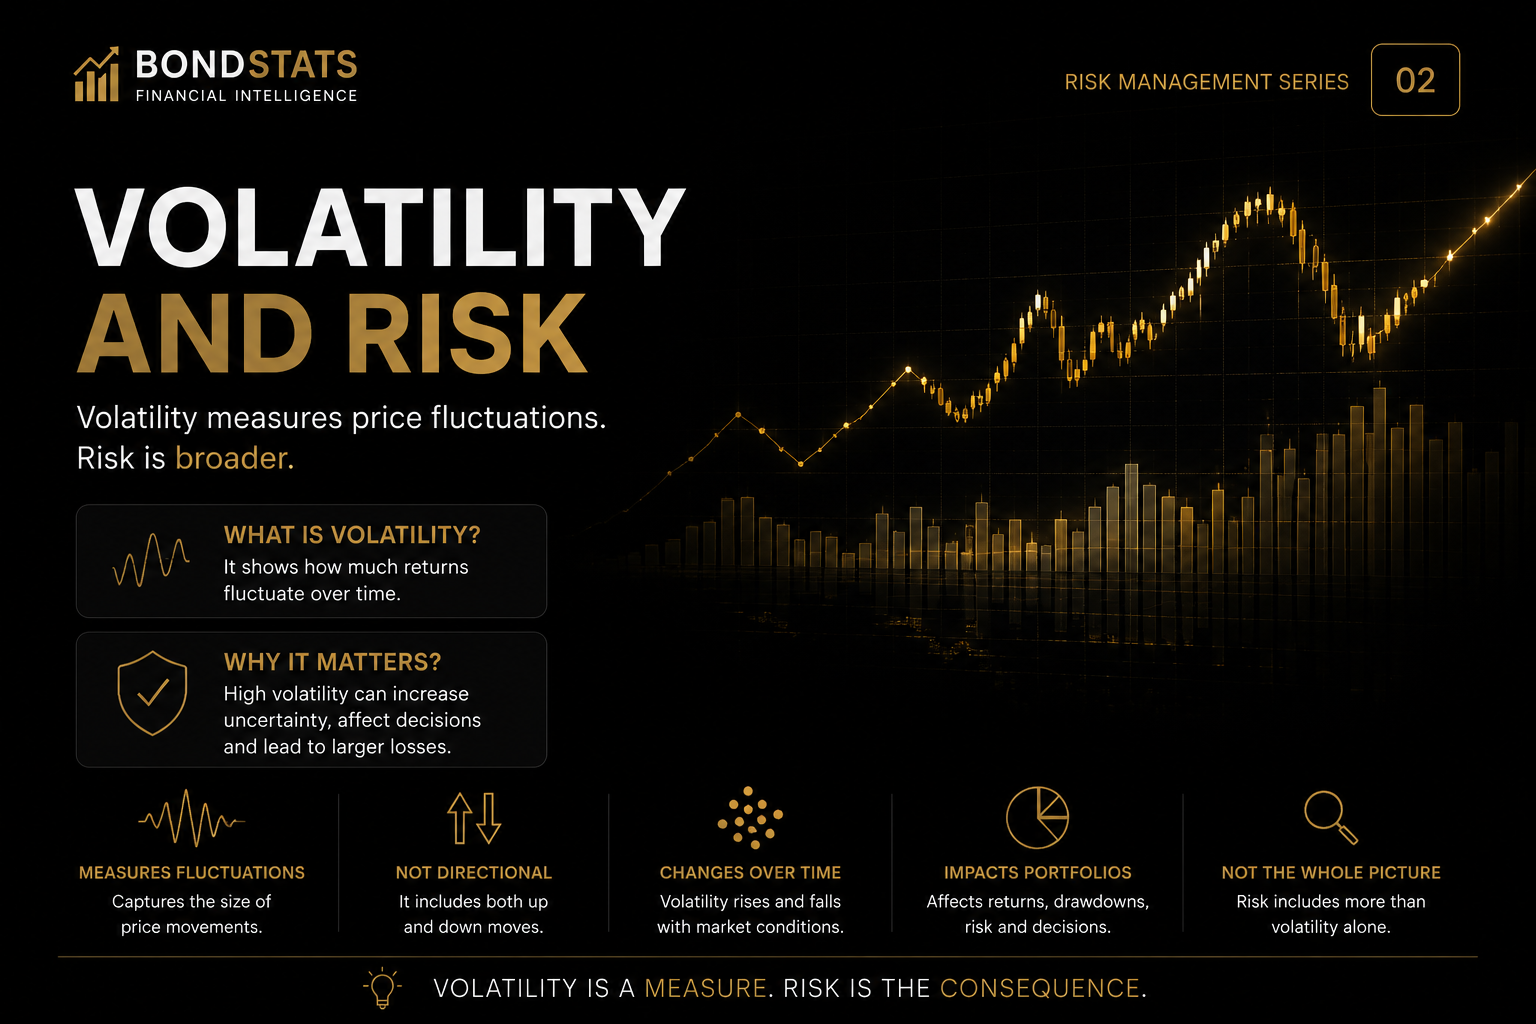
What Is Volatility?
Volatility describes the degree to which the price or return of an asset changes over time and an asset whose returns remain close to their average has relatively low volatility.
An asset that experiences large positive and negative movements has relatively high volatility.
Consider two hypothetical assets.
Asset A
Monthly returns:
+1%
+2%
0%
+1%
-1%
+2%
Asset B
Monthly returns:
+10%
-8%
+12%
-9%
+7%
-6%
Asset B experiences much larger fluctuations and it therefore has higher volatility.
Even if both assets eventually produce a similar total return, the path taken to reach that result can be very different.
Why Volatility Matters
Volatility matters because large fluctuations can affect:
portfolio stability,
investor behaviour,
required liquidity,
position sizing,
leverage,
drawdowns,
risk limits,
rebalancing decisions.
For example, an investor may theoretically accept a long-term strategy but abandon it after a severe short-term decline.
In that case, volatility becomes practically important because it influences the probability of poor decisions under stress.
A Simple Example
Suppose an asset produces the following annual returns:
8%
9%
7%
8%
8%
The returns remain close to the average but volatility is relatively low.
Now consider:
30%
-20%
25%
-15%
20%
The returns fluctuate much more dramatically and volatility is higher.
The second asset may still generate attractive long-term returns, but the path is less stable.
Historical Volatility
Historical volatility is calculated from past observed returns.
For example, an analyst may calculate volatility using:
daily returns,
weekly returns,
monthly returns.
The chosen observation period matters and a 20-day volatility estimate may look very different from a five-year estimate.
This creates an important limitation:
Historical volatility describes what happened during the selected period. It does not guarantee what will happen next and a calm historical period may underestimate future instability.
Volatility Is Not Directional
This is one of the most important concepts and volatility does not inherently distinguish between positive and negative movements.
A sharp rise can increase measured volatility and a sharp fall can also increase measured volatility.
Consider:
+15%
+12%
+18%
These are large positive movements and they can still contribute to high volatility. Yet many investors do not view strong positive returns as “risk” in the same way they view large losses.
This is one reason volatility is an incomplete measure of risk.
Upside and Downside Volatility
Traditional volatility treats deviations above and below the average similarly but investors often care more about negative outcomes. This leads to the concept of downside deviation and downside-focused measures examine harmful returns rather than all fluctuations.
This distinction appears in metrics such as:
downside deviation,
Sortino ratio,
semivariance,
lower partial moments.
The core idea is simple:
Not every deviation from the average is equally undesirable.
Volatility vs Permanent Loss
Imagine a high-quality asset falls 20% during a broad market panic and later recovers but now imagine a company appears stable for years but suddenly defaults and loses most of its value.
The first investment may have shown high volatility and the second may have shown low volatility before suffering permanent impairment.
This demonstrates a critical distinction:
Temporary price fluctuation and permanent loss of capital are not the same thing.
Risk management should consider both.
The Hidden Risk of Low Volatility
Low volatility can create a false sense of security.
An asset may appear stable because:
it trades infrequently,
prices are based on models,
market liquidity is weak,
losses have not yet been recognized,
the observation period was unusually calm.
Examples may include certain:
private assets,
thinly traded securities,
structured products,
credit instruments,
property valuations.
A smooth price series does not necessarily mean the underlying economic risk is low.
Volatility Clustering
Financial volatility often changes over time and large market movements tend to be followed by periods of elevated volatility.
Calm periods may also persist.
This phenomenon is known as volatility clustering.
In simple terms:
High-volatility periods often occur near other high-volatility periods, while calm periods often occur near other calm periods. This matters because risk is not constant.
A portfolio calibrated during a calm market may behave very differently during a crisis.
Volatility Regimes
Markets can move between different volatility environments.
Low-Volatility Regime
Often associated with:
stable economic conditions,
abundant liquidity,
limited market stress,
strong investor confidence.
High-Volatility Regime
May be associated with:
recessions,
financial crises,
geopolitical shocks,
inflation surprises,
policy uncertainty,
liquidity stress.
Risk models that assume constant volatility may fail to capture these regime changes.
The Problem With Changing Correlations
Diversification can weaken during periods of stress and assets that previously behaved differently may suddenly begin moving in the same direction.
For example:
investors sell multiple asset classes simultaneously,
liquidity disappears,
correlations rise,
diversification benefits shrink.
This creates an important risk-management lesson:
Historical diversification may not remain equally effective during future crises.
Implied Volatility
Historical volatility looks backward and implied volatility is derived from market prices, particularly options. It reflects the level of future volatility embedded in option prices under an option-pricing framework.
Implied volatility is often interpreted as a market-based indicator of uncertainty.
However, it is not a perfect forecast.
It is influenced by:
supply and demand,
hedging activity,
risk premia,
market stress,
option pricing assumptions.
Volatility and Time Horizon
The meaning of volatility depends partly on the investor’s horizon. A short-term investor may be highly sensitive to daily price movements.
A long-term investor may care more about:
permanent capital loss,
inflation erosion,
failure to meet liabilities,
long-term purchasing power.
The same asset can therefore represent different risks to different investors.
Volatility and Leverage
Leverage can magnify the consequences of volatility and now uppose an unleveraged portfolio falls 10%.
The loss is painful but potentially manageable.
If the same exposure is heavily leveraged, the decline may:
trigger margin calls,
force asset sales,
reduce liquidity,
create cascading losses.
This means volatility becomes especially dangerous when combined with leverage and volatility is not isolated from portfolio structure.
Volatility Drag
Large fluctuations can reduce compounded growth.
Consider two periods:
Year 1: +50%
Year 2: -50%
A common mistake is to think the investor has returned to the starting point.
But:
100 \times 1.50 = 150
Then:
150 \times 0.50 = 75
The final value is 75 and that represents a total loss of 25%.
This illustrates an important principle:
Percentage gains and losses are asymmetric and a 50% loss requires a 100% gain to recover.
When Volatility Is Useful
Volatility remains extremely useful when applied appropriately.
It can help with:
comparing assets,
estimating portfolio variability,
position sizing,
risk budgeting,
options analysis,
stress monitoring,
evaluating risk-adjusted performance.
The problem is not volatility itself but the problem is treating volatility as a complete definition of risk.
When Volatility Can Mislead
Volatility may provide an incomplete picture when:
returns are not normally distributed,
extreme events occur more frequently than expected,
liquidity disappears,
correlations change,
leverage is hidden,
historical data is limited,
prices are stale,
structural breaks occur.
A robust risk framework therefore combines volatility with other measures.
These may include:
maximum drawdown,
Value at Risk,
Expected Shortfall,
stress testing,
scenario analysis,
liquidity analysis,
concentration analysis,
credit analysis.
Practical Portfolio Example
Imagine two portfolios.
Portfolio A
annual return: 8%
annual volatility: 7%
maximum drawdown: -10%
Portfolio B
annual return: 10%
annual volatility: 18%
maximum drawdown: -35%
Portfolio B generated a higher return.
But it also experienced:
greater fluctuations,
a much deeper drawdown,
potentially greater behavioural pressure.
Which portfolio is better?
There is no universal answer.
The decision depends on:
objectives,
time horizon,
liquidity needs,
risk capacity,
tolerance for losses.
Key Takeaways
Volatility measures the dispersion of returns.
High volatility is not identical to high total risk.
Low volatility does not guarantee safety.
Traditional volatility treats upside and downside movements similarly.
Historical volatility is backward-looking.
Implied volatility reflects information embedded in option prices.
Portfolio volatility depends on correlations as well as individual asset volatility.
Correlations can change during crises.
Leverage can magnify the consequences of volatility.
Severe losses require disproportionately large gains to recover.
Volatility should be combined with broader risk measures.