
What Yield Curves Signal
Understanding how the shape of the yield curve reveals expectations for growth, inflation, and future interest rates.
Introduction
The yield curve is one of the most closely watched indicators in global finance because it compares interest rates across government bonds with different maturities, from short-term debt to long-term debt. While it may appear to be a simple line on a chart, the yield curve often provides valuable insight into investor expectations about economic growth, inflation, and monetary policy.
Changes in the yield curve can signal optimism, caution, or even growing recession risks and understanding the yield curve helps explain how financial markets interpret the future.
What Is the Yield Curve?
The yield curve plots government bond yields across different maturities.
For example:
3-Month Treasury
2-Year Treasury
5-Year Treasury
10-Year Treasury
30-Year Treasury
The resulting curve shows how borrowing costs change over time.
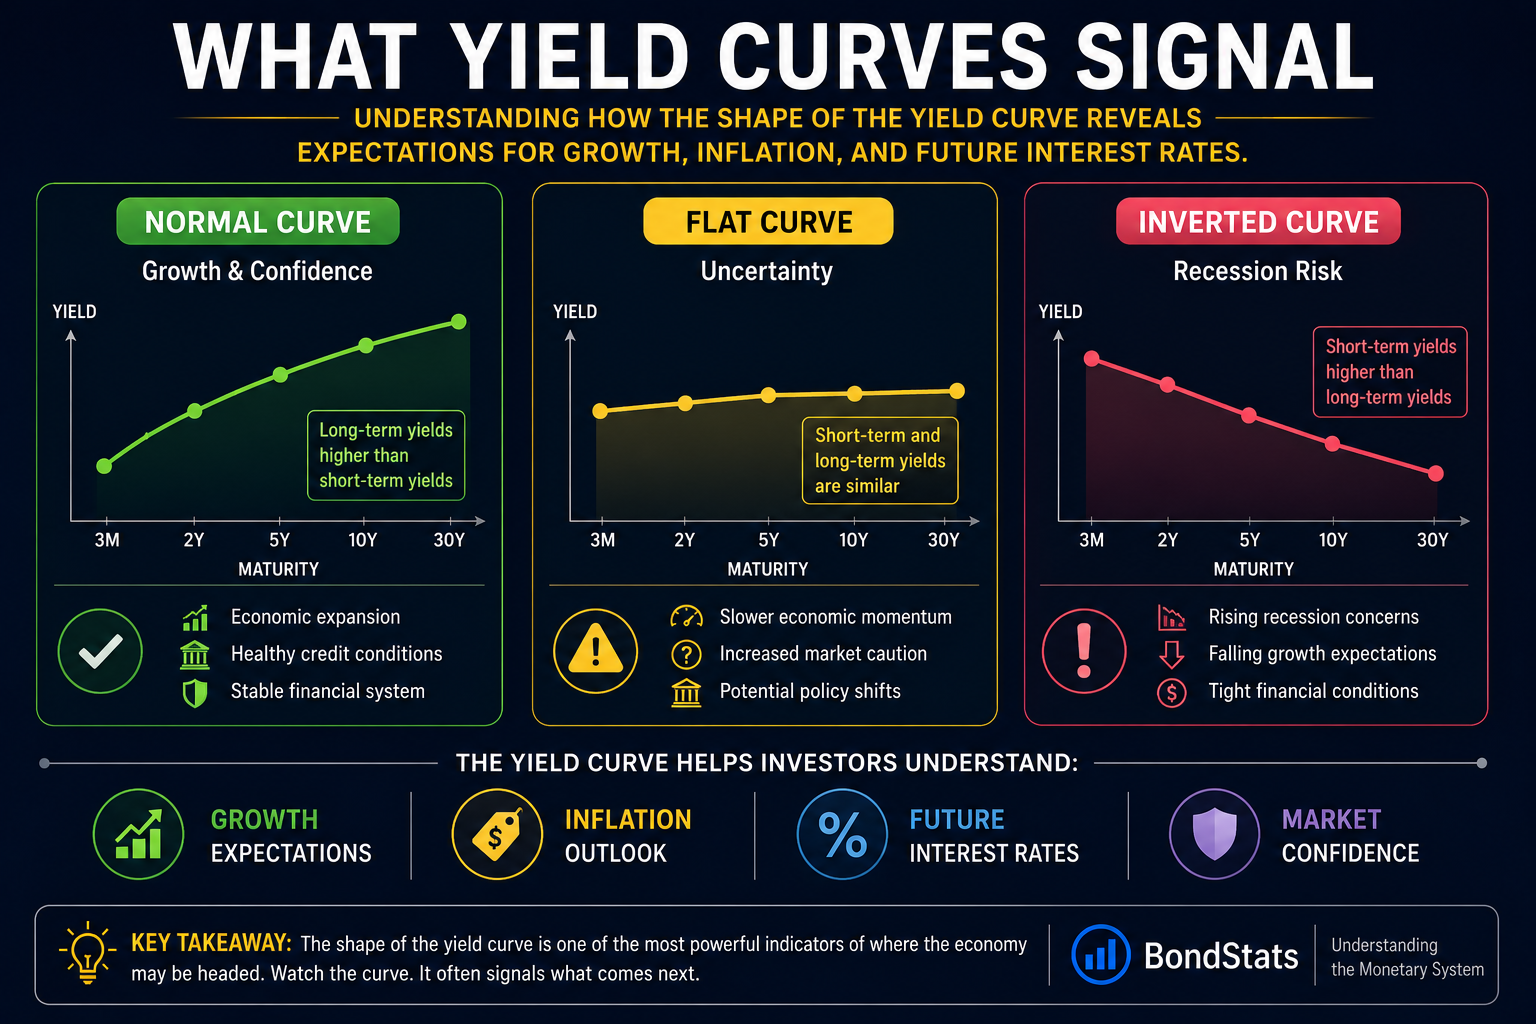
A Normal Yield Curve
Under normal conditions:
Long-term yields are higher than short-term yields.
Investors demand additional compensation for lending money over longer periods.
Growth expectations are generally positive.
Signals
✅ Economic expansion
✅ Healthy credit conditions
✅ Stable financial system
A Flat Yield Curve
A flat yield curve occurs when short-term and long-term yields move closer together.
This often signals:
Slowing growth expectations
Greater economic uncertainty
A transition period in the business cycle
Signals
⚠️ Slower economic momentum
⚠️ Increased market caution
⚠️ Potential policy shifts
An Inverted Yield Curve
An inverted yield curve occurs when short-term yields rise above long-term yields. Historically, this has been one of the most closely followed recession indicators.
Investors may expect:
Future interest rate cuts
Slower economic growth
Weakening economic conditions
Signals
🔴 Rising recession concerns
🔴 Falling growth expectations
🔴 Tight financial conditions
Why Investors Watch Yield Curves
Yield curves help investors understand:
Economic expectations
Inflation outlook
Interest rate expectations
Recession risks
Market confidence
For this reason, yield curves are monitored by:
Central banks
Investors
Governments
Financial institutions
Yield Curves and the Monetary System
The yield curve connects monetary policy with financial markets.
Changes in:
Interest rates
Inflation expectations
Economic growth
Bond demand
all influence the shape of the curve.
Because government bonds form the foundation of global financial markets, yield curves provide insight into the broader monetary system.
Key Takeaway
Yield curves signal how markets view the future.
A normal curve often reflects confidence and growth while an flat curve may indicate caution. An inverted curve can signal rising recession concerns.
Understanding yield curves helps explain how investors, bond markets, and central banks interpret economic conditions.